Medical billing KPIs and benchmarks for 2026 are the specific performance targets — commonly a 95%+ clean claim rate, fewer than 30 days in accounts receivable, and a denial rate under 5% — that top-performing practices use to gauge revenue cycle health. These figures combine published HFMA MAP Key definitions, MGMA DataDive benchmarking ranges, and recommended operating targets used across the RCM industry. Comparing a practice’s own numbers against them shows where claims, coding, or collections are leaking revenue.
Medical Billing KPIs & Benchmarks for 2026
A full waiting room doesn’t always mean a healthy bank balance. When claims go out the door but cash arrives late, short, or not at all, the gap between patient volume and collected revenue is a revenue cycle management (RCM) problem — one that needs measurement, not guessing.
This guide shows exactly which key performance indicators (KPIs) to track, what the 2026 targets are, where each benchmark actually comes from, how those numbers shift by specialty, and the practical steps that move a struggling metric back into range. A self-assessment checklist near the end lets you score your own practice against the numbers below in about five minutes.
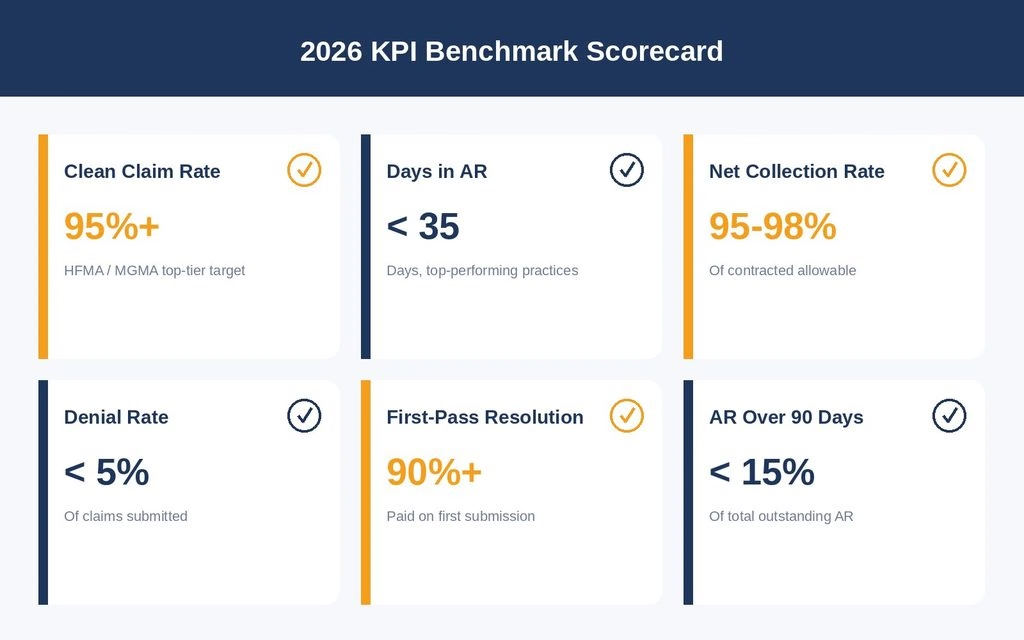
2026 Medical Billing KPI Cheat Sheet
A quick-reference view of the numbers covered in this guide. Each KPI is explained, sourced, and broken down in full further down the page.
| KPI | Practical 2026 Target | Review Frequency | Primary Source |
| Clean Claim Rate | 95%+ | Weekly | HFMA definition + RCM benchmark |
| Denial Rate | Under 5% | Weekly | RCM industry benchmark |
| First-Pass Resolution Rate | 90%+ | Weekly | MGMA-aligned / RCM benchmark |
| Days in AR | Under 30 days | Monthly | MGMA DataDive |
| Net Collection Rate | 97%+ | Monthly | HFMA definition + RCM benchmark |
| AR Over 90 Days | Under 15% of total AR | Monthly | MGMA-aligned / RCM benchmark |
| Cost to Collect | Under 3% | Quarterly | RCM industry benchmark |
“HFMA definition + RCM benchmark” means HFMA publishes the metric’s formal definition and calculation as a MAP Key, while the specific percentage target reflects the range most commonly referenced across HFMA-aligned industry benchmarking — not a fixed number mandated by HFMA itself. “MGMA DataDive” points to MGMA’s segmented benchmarking data set. “RCM industry benchmark” and “MGMA-aligned / RCM benchmark” mean a practical operating target compiled from RCM industry sources rather than a single universal published standard. Full detail is in the Sources & Methodology section near the end of this guide.
What Are Medical Billing KPIs, and Why Do 2026 Benchmarks Matter?
A medical billing KPI is a measurable data point that reflects how efficiently a practice converts patient visits into collected revenue. Every KPI ties back to one of three questions: how fast is the practice getting paid, how much of what it is owed does it actually collect, and how many claims require rework before payment arrives. Together, these numbers form a scorecard for the entire revenue cycle, from the moment a patient books an appointment to the day the final payment posts.
Benchmarks give those numbers meaning, but not all benchmarks carry the same weight. The Healthcare Financial Management Association (HFMA) publishes MAP Keys — standardized definitions and calculations for revenue-cycle metrics such as clean claim rate and net collection rate — which function as the industry’s closest thing to an official standard. MGMA’s DataDive data set takes a different approach: rather than one fixed number, it lets a practice filter benchmarking data by specialty, geographic region, organization size, ownership type, and physician FTEs, so a comparison can be genuinely apples-to-apples instead of measured against a single blended national average. Where this guide cites a range instead of one of these two sources, it is flagged as a recommended operating target rather than a published industry standard.
What Changed in Medical Billing Benchmarks for 2026?
A handful of concrete, sourced developments are shaping this year’s targets:
- Prior authorization volume keeps growing. In AMA’s most recent physician survey, respondents reported completing an average of roughly 40 prior authorization requests per week, consuming about 13 hours of physician and staff time — a direct drag on days in AR and first-pass resolution for any claim that requires authorization.
- Denial rates have trended upward. Multiple RCM industry trackers report national claim denial rates climbing in recent years, with some sources citing double-digit initial denial rates — reinforcing why a sub-5% denial rate is a meaningful differentiator rather than a routine target.
- Patient financial responsibility is rising. RCM industry analyses point to record increases in average ACA Marketplace deductibles this year, shifting more of the payment burden to patients and making point-of-service collection a bigger lever than in past years.
- CMS’s 2026 Medicare Physician Fee Schedule reshaped per-claim reimbursement. The 2026 update revised conversion factors and site-of-service payment calculations for many specialties, changing what a “clean” and correctly coded claim actually pays — which raises the cost of coding errors and makes first-pass accuracy more consequential than in prior years.
None of this means 2026 targets are unreachable. It means the practices hitting them are doing more upfront work — eligibility checks, coding accuracy, and claim scrubbing — before a claim ever leaves the building, rather than cleaning up denials after the fact.
The Core Financial KPIs Every Practice Should Track in 2026
These three KPIs measure the overall financial health of the revenue cycle. If a practice tracks nothing else, these numbers should still be reviewed monthly.
| KPI | Formula | Practical 2026 Target | Needs Attention | Source |
| Days in AR | Total AR ÷ Average daily charges | Under 30 days | Over 50 days | MGMA DataDive |
| Net Collection Rate | Payments ÷ (Charges − Contractual Adj.) | 97%+ | Below 90% | HFMA def. + RCM benchmark |
| Cost to Collect | Total billing/RCM cost ÷ Total collections | Under 3% | Over 5% | RCM industry data |
Days in Accounts Receivable (AR)
Days in AR measures how long, on average, a practice waits to collect payment after a claim goes out. MGMA’s DataDive Financials and Operations data set tracks this metric across thousands of practices, segmented by specialty and size, which is why it is cited here as the primary source rather than a single fixed industry rule.
Formula: Total Accounts Receivable ÷ Average Daily Charges
Worked example: If a practice’s outstanding AR is $900,000 and average daily charges are $30,000, Days in AR = $900,000 ÷ $30,000 = 30 days.
Net Collection Rate
Where the clean claim rate measures process quality, net collection rate (NCR) measures the bottom line: of everything the practice is contractually owed, how much actually gets collected. NCR is one of HFMA’s published MAP Keys, with the formula and definition formally standardized. A rate below 90% typically signals hidden write-offs, missed timely-filing deadlines, or services that were never billed at all; a practical target for 2026 is 97% or higher.
Formula: Payments Collected ÷ (Charges − Contractual Adjustments) × 100
Worked example: A practice collects $475,000 against $500,000 in charges after $10,000 in contractual adjustments. Net Collection Rate = $475,000 ÷ ($500,000 − $10,000) × 100 = $475,000 ÷ $490,000 × 100 ≈ 97%.
Cost to Collect
This KPI answers a simple question: how much does it cost the practice, in staff time and systems, to collect one dollar of revenue? A cost-to-collect ratio under 3% is a commonly cited operating target across RCM industry benchmarking — it is not a single published HFMA or MGMA figure, but a widely used practical threshold. Practices running in-house billing with manual claim scrubbing and no denial-tracking system frequently see this number climb past 6–8%, quietly eroding margin that never shows up as a single line item.
Claims & Denial Management KPIs for 2026
These KPIs catch problems before they become AR problems. A weak number here today becomes a slow-paying claim in 30 days.
| KPI | Commonly Reported Range | Practical Target | Source |
| Clean Claim Rate | 85%–90% | 95%+ | HFMA definition + RCM benchmark |
| First-Pass Resolution Rate | 80%–85% | 90%+ | MGMA / RCM data |
| Denial Rate | 8%–12% | Under 5% | RCM industry data |
| Denial Overturn Rate on Appeal | Below 50% | 60%+ | RCM industry data |
Clean Claim Rate
A clean claim passes payer edits and adjudicates on the first submission, with no missing information and no manual intervention required. HFMA’s MAP Keys establish clean claim rate as a formal, standardized revenue-cycle metric with a defined calculation. The 95%+ figure cited as a 2026 target reflects the range most commonly referenced across HFMA-aligned RCM benchmarking rather than a single fixed HFMA mandate — practices should treat it as a strong, well-supported target rather than a regulatory requirement.
Formula: Clean Claims ÷ Total Claims Submitted × 100
Worked example: A practice submits 1,000 claims in a month and 920 are accepted and paid on first submission. Clean Claim Rate = (920 ÷ 1,000) × 100 = 92%.
First-Pass Resolution Rate
Closely related to clean claim rate, first-pass resolution rate tracks the share of claims paid in full on the very first submission, with no appeal or resubmission needed. A rate above 90% indicates a front-end process — eligibility verification, coding, charge entry — that is catching errors before they reach the payer.
Denial Rate
The denial rate divides denied claims by total claims submitted.
Formula: Denied Claims ÷ Total Claims Submitted × 100
Under 5% is the practical 2026 target for top performers; several RCM industry sources report national averages closer to 8–12%, with some tracking initial denial rates into the double digits.
Worked example: A practice submits 600 claims in a month and 42 come back denied. Denial Rate = (42 ÷ 600) × 100 = 7% — above the 5% target and worth a payer-by-payer review.
A denial rate creeping upward is often the earliest warning sign of a coding change, a new payer policy, or a credentialing gap that has not yet been caught — worth routing straight into a structured denial management and appeals process rather than letting individual denials pile up.
Illustrative scenario (not an actual client record): a practice’s denial rate drifts from 4% to 7% over three months. At 4%, the shift is easy to write off as normal variation; at 7%, it’s worth investigating — and a payer-level breakdown traces it to one payer’s updated modifier requirement. Correcting that one modifier on affected claims is often a fix measured in days, not months, once the specific cause is identified.
Denial Overturn Rate on Appeal
Not every denial is final. This KPI tracks what percentage of appealed denials actually get overturned and paid. A rate below 40% suggests appeals are being filed without strong supporting documentation, while a rate at or above 60% shows a billing team that appeals selectively and effectively rather than contesting every denial regardless of merit.
AR Aging, Collections & Patient-Pay KPIs
As patient financial responsibility grows, these KPIs are becoming just as important as payer-facing metrics. The figures below are recommended operating targets drawn from MGMA-aligned RCM benchmarking rather than a single published standard.
AR Over 90 Days
This KPI measures the percentage of total outstanding AR that has aged past 90 days — the point at which collectability drops sharply. A practical target keeps this figure under 15% of total AR; above 25% usually points to unworked denials, patients who have not been reached for balances, or claims sitting in a payer queue with no follow-up.
Formula: AR Aged Over 90 Days ÷ Total Outstanding AR × 100
Worked example: A practice has $250,000 in total outstanding AR, of which $30,000 has aged past 90 days. AR Over 90 Days = ($30,000 ÷ $250,000) × 100 = 12% — inside the target range.
A practice consistently over the 15% threshold usually needs a structured follow-up system rather than sporadic effort — this is one of the areas covered under Zmed Solutions’ revenue cycle management services.
Patient Collection Rate at Point of Service
With average Marketplace deductibles reaching a record high this year, collecting copays and estimated balances before the patient leaves the office matters more than in past years. A point-of-service collection rate of 50% or higher is a reasonable 2026 target; practices below 30% typically rely on mailed statements after the visit, which recover only a fraction of what upfront collection captures.
Bad Debt Rate
Bad debt rate tracks the percentage of billed charges written off as uncollectible. A rate under 3% is a healthy practical target; a rate above 6% suggests either a patient population facing genuine financial hardship or a collections process that gives up on balances too early, before payment plans or financial counseling are offered.
Illustrative KPI Targets by Specialty
Blended, practice-wide averages hide a lot. A cardiology practice and a behavioral health practice run on very different payer mixes, documentation requirements, and prior authorization loads. The ranges below are illustrative — directionally consistent with MGMA-aligned specialty benchmarking and RCM industry data, but not pulled from a single published MGMA or HFMA table specific to each specialty. Treat them as a reasonable starting comparison point, not a sourced industry mandate, and verify against your own MGMA DataDive access where precision matters.
| Specialty | Days in AR (Illustrative) | Clean Claim Rate | Denial Rate |
| Primary Care / Family Medicine | Under 22 days | 98%+ | Under 4% |
| Cardiology | Under 28 days | 97%+ | Under 5% |
| Orthopedics | Under 30 days | 97%+ | Under 6% |
| Behavioral Health | Under 30 days | 96%+ | Under 7% |
| Ambulatory Surgery Centers | Under 25 days | 98%+ | Under 4% |
The pattern holds across specialties: first-pass resolution, clean submissions, and fast follow-up consistently separate top performers from the pack, regardless of how complex the coding or how heavy the prior authorization burden.
Specialty-specific benchmarks call for specialty-specific billing processes — practices that want a closer, practice-specific comparison can explore Zmed Solutions’ revenue cycle management services.
Medical Billing KPIs & Benchmarks 2026-How to Use These Benchmarks Correctly?
A benchmark is only useful when the comparison is like-for-like. Before judging a practice’s performance against any number in this guide, match it against the same specialty, similar payer mix, comparable practice size, and the same reporting period — a raw comparison against a blended national average will usually mislead more than it helps.
- Match specialty first. A cardiology practice with a heavy Medicare and commercial mix will show very different AR and denial patterns than a behavioral health practice — compare within the same specialty group whenever possible.
- Check payer mix before reacting to a gap. A practice with a high share of out-of-network or self-pay patients will naturally run a longer AR cycle and lower net collection rate than one that is mostly in-network.
- Compare like practice sizes. A solo practice and a 40-provider group manage eligibility, coding, and denial follow-up very differently, which shows up directly in first-pass resolution and days in AR.
- Use a consistent reporting period. Monthly figures can swing on timing alone — a strong February and a weak March may average out to a target-range quarter that hides a real process problem.
- Treat a single missed benchmark as a signal to investigate, not a verdict. One weak month in one metric is a prompt to look at payer-level and provider-level detail, not a reason to overhaul the whole billing process.
How Long Does It Take to See Improvement?
Every practice’s starting point is different, but the general pattern below is a useful expectation-setter. “Front-end fixes” are the process changes themselves; “full impact” is when that change has worked its way through the entire billing cycle and shows up clearly in the KPI.
| KPI | Front-End Fix Visible In | Full Impact By |
| Clean Claim Rate | 30–45 days | 60–90 days |
| Denial Rate | 60–90 days | 90–120 days |
| Days in AR | 90 days | 120–180 days |
| Net Collection Rate | 90 days | 120–180 days |
Front-end fixes include updated eligibility verification, tighter claim scrubbing, and front-desk training — changes that are visible almost immediately in weekly claims data. Full impact accounts for the time it takes denials to be worked, corrected claims to be resubmitted, and payments to actually post. These are general planning ranges, not a guarantee for any specific practice; a heavier existing AR backlog or a more complex payer mix can extend the full-impact timeline. Setting this expectation upfront is what keeps a practice from abandoning a fix after three weeks because the AR number hasn’t moved yet.
Technology to Support Your KPI Tracking
The right tools make consistent KPI tracking far less effort than it sounds. Medical Billing KPIs & Benchmarks 2026-Four categories cover most of what a practice needs:
- Claim scrubbing software — checks claims for errors automatically before submission, which is the single biggest lever on clean claim rate.
- Denial tracking tools — categorize denials by reason and payer so patterns are visible instead of buried in a shared inbox.
- Analytics dashboards — visualize KPIs in something closer to real time instead of a month-end scramble to pull numbers.
- EHR / practice management integration — pulls billing data directly from the system already in use, rather than duplicating entry.
Practices without dedicated analytics tools can still get most of the value from a simple, consistently updated spreadsheet — the numbers matter more than the software, at least until volume outgrows what a spreadsheet can handle.
Building a KPI Dashboard Practices Will Actually Use
Tracking a KPI once, for a single report, rarely changes anything. The practices that hit 2026 benchmarks build a lightweight, recurring habit around these numbers instead, often supported by dedicated healthcare analytics and RCM reporting dashboards rather than a manually updated spreadsheet.
Medical Billing KPIs & Benchmarks 2026-Set a Weekly Cadence for Claims Metrics
Clean claim rate, denial rate, and first-pass resolution move fast enough that a monthly review misses the early warning signs. A five-minute weekly check-in, even a simple spreadsheet, catches a payer policy change or a coding error long before it becomes a wave of denials.
Medical Billing KPIs & Benchmarks 2026-Reserve Monthly Reviews for Financial KPIs
Days in AR, net collection rate, and cost to collect move more slowly and reflect the cumulative effect of upstream processes. A monthly review, ideally with the same report format each time, makes month-over-month trends easy to spot.
Medical Billing KPIs & Benchmarks 2026-Segment by Payer, Not Just Practice-Wide
A practice-wide number hides more than it reveals. A 6% denial rate looks manageable until it’s broken apart: Payer A running at 2%. Payer B at 4%, and Payer C at 15%. The practice-wide average buries the one payer that is actually the problem. The one most worth a renegotiation conversation or a targeted process fix.
Breaking every KPI out by payer, and by provider for larger groups. Turns a vague “billing problem” into a specific one that is much faster to fix. This is often the single highest-leverage change a practice can make to its KPI dashboard.
Assign an Owner to Each Number
A KPI with no one responsible for it rarely improves. Denial rate might belong to the coding lead, point-of-service collections to the front desk manager. AR follow-up to a dedicated biller — with the practice owner or office manager reviewing the full dashboard monthly.
What We See in Medical Billing Operations?
In our experience working with physician practices. The most common pattern behind a missed benchmark is rarely a single catastrophic billing error. It is the accumulation of smaller gaps — an eligibility check skipped during a busy morning. A coding correction that takes a week to route back to the biller. A denial that sits unworked for three weeks, or a patient balance that never gets a second follow-up. Individually, none of these feels urgent. Together, they are usually what separates a 40-day AR cycle from a 25-day one.
Medical Billing KPIs & Benchmarks 2026-The practices that close that gap fastest are not necessarily the ones with the most billing staff. They are the ones with the clearest process: who checks eligibility.. Who scrubs a claim before it goes out. Who owns a denial once it comes back, and how often someone actually looks at the numbers in this guide rather than assuming they are fine.
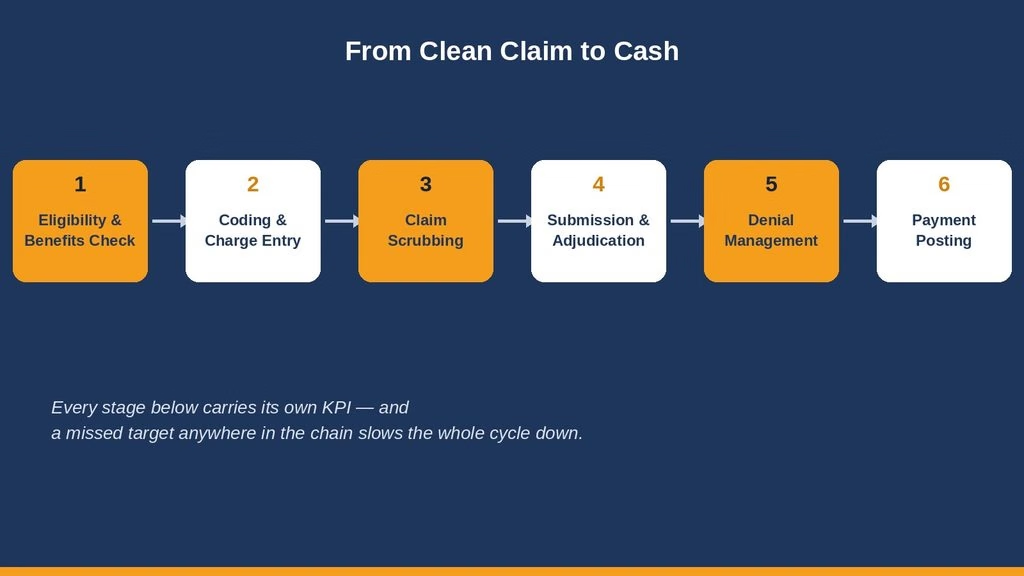
In plain terms, that workflow runs: (1) eligibility and benefits check, confirming active coverage before the visit; (2) coding and charge entry, translating the visit into billable codes; (3) claim scrubbing, catching errors before submission; (4) submission and adjudication, when the payer processes the claim; (5) denial management, working and appealing anything that comes back; and (6) payment posting, closing the loop. Each stage carries its own KPI from this guide, and a missed target anywhere in the chain slows the whole cycle down.
Common Reasons Practices Miss Their 2026 Benchmarks
- Eligibility gaps — coverage isn’t verified close enough to the date of service, so plan changes go unnoticed until a claim denies.
- Manual claim scrubbing — claims are reviewed inconsistently or not at all before submission, letting preventable errors reach the payer.
- Credentialing lag — a new provider sees patients before payer enrollment is complete, generating denials that take months to resolve.
- Unworked denials — denials sit in a queue with no dedicated follow-up, quietly aging into write-offs instead of moving through a structured appeals process.
- Prior authorization backlog — a growing volume of prior auth requests delays claims before they are ever billed.
- No specialty-specific benchmarking — comparing results to a generic industry average instead of the practice’s own specialty masks real problems.
When to Consider Professional RCM Support?
Not every gap between a KPI and its target means a practice needs outside help. Sometimes a coding correction or a staffing adjustment is enough. But a few patterns usually signal that in-house billing has hit its ceiling:
Patterns
- Multiple KPIs are off target at once — denial rate, days in AR, and clean claim rate all trending the wrong direction usually points to a process gap, not a one-off error.
- The same denial reasons keep recurring — if weekly denial review keeps surfacing the same root cause without it getting fixed, the team may be under-resourced to actually close the loop.
- Credentialing keeps lagging new hires — providers seeing patients before enrollment is complete is a structural gap, not a training issue.
- No one has time to look at the numbers — a KPI dashboard nobody reviews is the same as not having one.
If those patterns sound familiar, the next question is what to look for in outside support. A useful RCM partner should be able to show, specifically, how they handle eligibility verification, claim scrubbing, denial follow-up, and credentialing — the same four levers covered throughout this guide — rather than offering a general promise to “fix billing.”
Zmed Solutions is one example of this kind of structure: end-to-end medical billing and revenue cycle management — billing. Credentialing, coding, denial management, and compliance support — built around the KPIs in this guide. Every claim runs through eligibility verification and claim scrubbing before submission, and denials. They are routed into an active denial management and appeals workflow rather than left to age into write-offs. Results vary by practice, payer mix, and specialty; the goal of this structure is steady progress. Toward the benchmarks above, not a guaranteed fixed percentage.
Practices that want a closer look at how these numbers are tracked day to day can review the core metrics every practice should track in medical billing, or explore Zmed Solutions’ full revenue cycle management services.

Sources & Methodology
Medical Billing KPIs & Benchmarks 2026
This guide draws on three types of information, and the distinction matters for how confidently a number should be treated:
- Published HFMA MAP Keys — clean claim rate and net collection rate are formally defined, standardized revenue-cycle metrics published by the Healthcare Financial Management Association. Where this guide cites HFMA as the source, the metric’s definition and calculation are standardized; the specific percentage target reflects the range most commonly referenced across HFMA-aligned industry benchmarking.
- MGMA DataDive benchmarking data — days in AR, AR aging, and first-pass resolution figures draw on the type of segmented data MGMA’s Financials and Operations data set provides, filterable by specialty, geography, organization size, ownership, and physician FTEs. A practice with direct MGMA DataDive access can pull its own exact percentile comparison rather than relying on the general ranges in this guide.
- Recommended operating targets — figures such as cost-to-collect, point-of-service collection rate, bad debt rate, and the specialty-by-specialty table are practical targets compiled from RCM industry benchmarking rather than a single universal published standard. They are labeled as such throughout this guide.
- AMA survey data — the prior authorization statistics cited in the “What Changed for 2026” section come from AMA’s published physician survey results.
- Currency of the data — MGMA’s Financials and Operations DataDive data set reflects 2026 figures, and CMS’s 2026 Medicare Physician Fee Schedule is the current rule year, which is what keeps the “2026” label in this guide’s targets meaningful rather than a recycled prior-year figure.
Actual benchmarks vary by payer mix, practice size, specialty, geography, and contract terms. Figures in this guide reflect industry data and RCM benchmarking available at the time of research and should be treated as a starting comparison point, not a guarantee of any individual practice’s performance.
KPI Self-Assessment Checklist
Medical Billing KPIs & Benchmarks 2026-0Score your own practice against the ten questions below. One point for each “yes” — the scoring guide underneath shows roughly where that leaves you against the 2026 targets in this guide.
- Is your clean claim rate at 95% or higher?
- Is your denial rate under 5%?
- Is your first-pass resolution rate at 90% or higher?
- Is your days in AR under 30?
- Is your net collection rate at 97% or higher?
- Is less than 15% of your total AR aged past 90 days?
- Do you collect 50% or more of patient balances at point of service?
- Is your cost to collect under 3%?
- Do you review claims-related KPIs (clean claim rate, denial rate) at least weekly?
- Do you break KPIs out by payer rather than relying on a practice-wide average?
| Score | What It Suggests |
| 8–10 “yes” | Strong revenue cycle discipline — focus on holding these numbers steady and watching for payer-level drift. |
| 5–7 “yes” | Solid foundation with specific gaps — use the sections above to target the weakest 2–3 KPIs first. |
| 0–4 “yes” | Meaningful revenue is likely leaking somewhere in the cycle — start with clean claim rate and denial rate, since fixing those tends to improve everything downstream. |
Quick Summary
- Clean claim rate: practical target 95%+ (HFMA defines the metric; the percentage is an RCM-benchmark figure).
- Days in AR: practical target under 30 days (MGMA DataDive benchmarking).
- Denial rate: practical target under 5%; several RCM sources report national averages of 8–12%.
- Net collection rate: practical target 97%+ (HFMA defines the metric; the percentage is an RCM-benchmark figure).
- AR over 90 days: practical target under 15% of total outstanding AR.
- Benchmarks vary by specialty — compare against peers, not a blended average, and confirm precise figures against your own MGMA DataDive access where it matters.
- A weekly claims review plus a monthly financial review keeps KPIs from drifting unnoticed.
Final Thoughts
Medical billing KPIs are not a reporting exercise — they are the earliest, Medical Billing KPIs & Benchmarks 2026, clearest signal a practice has that something in the revenue cycle needs attention. A denial rate ticking upward, a clean claim rate slipping below 90%, or AR days climbing past 40 are all fixable problems when caught early, and expensive ones when left to compound for months.
Heading into 2026, the gap between top-performing practices and everyone else is widening, driven by tighter payer edits, growing prior authorization demands, and a bigger share of revenue now sitting with patients rather than payers. Closing that gap does not require a bigger billing team; it requires the right process, consistent measurement, and follow-through on the numbers once they are visible — and knowing which of those numbers are firm industry standards versus practical targets worth aiming for.
Whether a practice manages billing in-house or is evaluating outside support, the benchmarks in this guide offer a concrete starting point. Zmed Solutions works alongside practices of every size to build the eligibility checks, claim scrubbing, denial follow-up, and reporting that keep these KPIs moving in the right direction.
Frequently Asked Questions
Medical Billing KPIs & Benchmarks 2026
What are the most important medical billing KPIs to track?
The core set most practices should track monthly at minimum is clean claim rate, denial rate, days in AR, net collection rate, and first-pass resolution rate. These five cover claims quality, payer follow-through, and overall cash collection in one view.
What is a good clean claim rate in medical billing?
A clean claim rate of 95% or higher is a widely cited practical target. HFMA formally defines the clean claim rate metric as a MAP Key, though the 95%+ figure itself reflects common RCM-industry benchmarking rather than an HFMA-mandated number. Rates between 85% and 90% are average but leave meaningful revenue on the table, while anything below 80% points to a significant, fixable process problem.
How do you calculate clean claim rate?
Divide the number of clean claims — those paid on first submission with no errors or missing information — by total claims submitted, then multiply by 100. Submitting 1,000 claims with 920 paid clean on the first try gives a 92% clean claim rate.
What is a good denial rate for a medical practice?
A denial rate under 5% is a strong 2026 target. Several RCM industry sources put national averages closer to 8–12%, so a practice consistently below 5% is outperforming the broader field, not just meeting a baseline.
How is days in AR calculated, and what’s a good benchmark?
Days in AR equals total outstanding accounts receivable divided by average daily charges. A result under 30 days is a strong recommended target based on MGMA benchmarking data; results past 50 days usually mean claims or patient balances are going unworked for too long.
What is a good net collection rate?
97% or higher is a solid practical target for net collection rate. HFMA formally defines NCR as a MAP Key metric, though the 97% figure reflects common RCM-industry benchmarking rather than an HFMA-mandated threshold. A rate below 90% typically points to write-offs, missed filing deadlines, or unbilled services rather than a payer simply paying less than expected.
Which medical billing KPIs should be reviewed weekly versus monthly?
Claims-related KPIs — clean claim rate, denial rate, first-pass resolution — are best reviewed weekly, since they can shift quickly and compound if left unchecked. Financial KPIs like days in AR, net collection rate, and cost to collect move more slowly and are typically reviewed monthly.
Do KPI benchmarks really differ by specialty?
Yes. Payer mix, documentation requirements, and prior authorization volume vary significantly by specialty, which shifts realistic targets for days in AR, clean claim rate, and denial rate. Comparing results to a same-specialty benchmark gives a far more accurate read than a blended, practice-wide average.
What KPIs should a small medical practice prioritize first?
Smaller practices with limited billing staff typically see the fastest improvement by focusing on clean claim rate and denial rate first, since fixing front-end errors reduces the downstream AR and collections workload before those larger metrics can meaningfully improve.
What’s the difference between net collection rate and gross collection rate?
Net collection rate compares actual payments to what a practice is contractually owed after adjustments, making it the more accurate measure of collection effectiveness. Gross collection rate compares payments to full billed charges before adjustments, which is less useful since billed charges rarely reflect what payers have agreed to pay.
Related Resources
From Zmed Solutions:
• Core metrics every practice should track in medical billing
• Denial management and appeals services for medical practices
* Healthcare analytics and RCM reporting dashboards: the complete guide
• Revenue cycle management services
External sources:
• 42 CFR Part 447 — Timely Claims Payment (eCFR / CMS regulation)
* MGMA DataDive — Financial & Operational Benchmarking Data
• AMA — Prior Authorization Survey Results
Key Market Player
Ready to optimize your medical billing and boost your revenue? Look no further. Zmed Solutions LLC is your trusted partner in professional Medical Billing Services.
Join hundreds of satisfied healthcare providers who have already elevated their revenue with our expert services. Don't miss out on what could be your practice's most profitable decision.
Schedule a Consultation Today!
Contact Us Now, and experience the difference. Your financial success starts here!