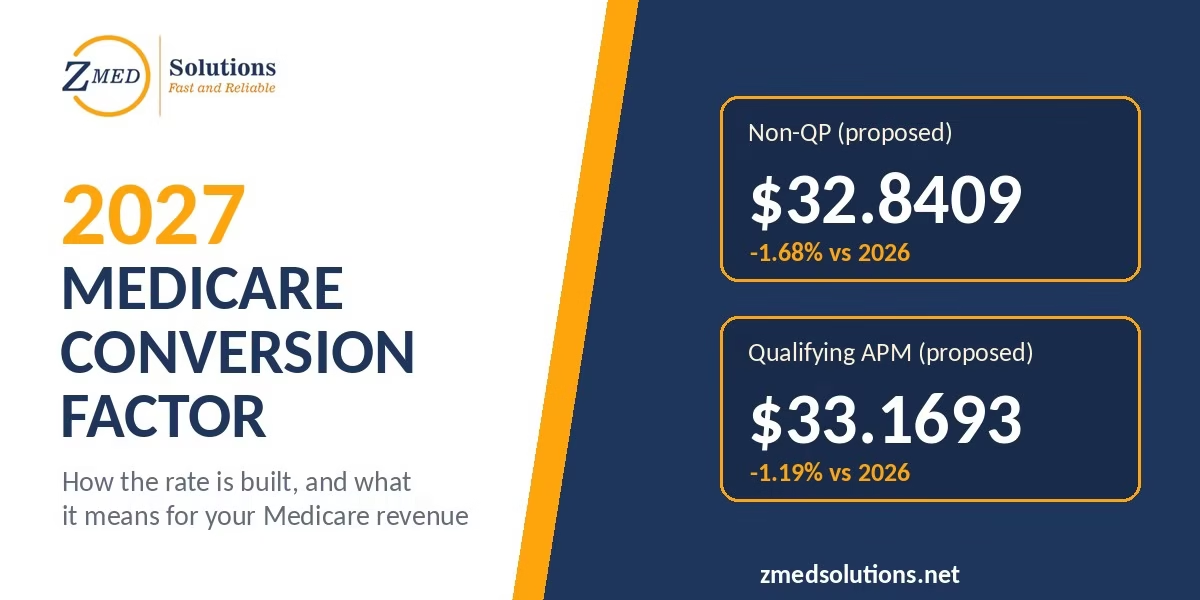
The 2027 Medicare conversion factor is the dollar multiplier CMS applies to relative value units to set Physician Fee Schedule payments. CMS has proposed $32.8409 for most clinicians and $33.1693 for qualifying Advanced APM participants, decreases of 1.68% and 1.19% from 2026. Final figures arrive with the CMS final rule, commonly expected around November 1.
Every Medicare Part B payment your practice receives passes through one number, and that number is about to shrink. The 2027 Medicare conversion factor is proposed at $32.8409, a 1.68% drop for most clinicians. This guide shows exactly how CMS builds that figure, how it compares with recent years, and how to turn it into dollars for your practice. You will find four worked examples, a year-by-year history table, and a payer-level view showing where the cut really lands. A 9-question readiness scorecard near the end helps you judge whether your team is prepared. All 2027 figures are proposed, so they may change when CMS publishes the final rule.
2027 Medicare Conversion Factor Numbers in One Table
| Figure | Value / Practical Target | Review Frequency | Primary Source |
| Non-QP conversion factor | $32.8409 (−1.68% vs. $33.4009) | At final rule, then yearly | CMS proposed rule |
| QP conversion factor | $33.1693 (−1.19% vs. $33.5675) | At final rule, then yearly | CMS proposed rule |
| Anesthesia CF (non-QP / QP) | $20.2143 / $20.4165 | At final rule | CMS proposed rule, via Holland & Knight |
| Statutory update | +0.25% non-QP / +0.75% QP | Yearly | CMS proposed rule (MACRA) |
| Budget neutrality adjustment | +0.53% | Yearly | CMS proposed rule |
| Expiring one-year increase | 2.5% (applied to 2026 only) | Watch Congress | CMS proposed rule |
| Inflation-adjusted pay change | −33% (2001–2025) | Reference only | AMA analysis |
| Final CF loaded in PM system | Before first January claims | Once, early January | Illustrative target |
| Paid-vs-expected Medicare variance | Near zero; investigate repeats | Monthly | Illustrative target |
Source labels: “CMS proposed rule” means CMS published the figure in its CY 2027 proposed rule or fact sheet; it may change in the final rule. “Via [organization]” means a CMS figure as summarized by that named organization. “AMA analysis” is the AMA’s own calculation, not a CMS figure. “Illustrative target” means a practical planning target drawn from general revenue cycle practice, not a CMS requirement.
What the Conversion Factor Does to Every Claim?
The Medicare Physician Fee Schedule assigns each service relative value units (RVUs) for physician work, practice expense, and malpractice. Each component is adjusted by geographic practice cost indices (GPCIs) for your locality. The conversion factor then turns those adjusted units into dollars. Because it multiplies every line, a 1.68% drop in the conversion factor lowers every service by the same percentage before any code-level changes. That makes it the single most important number in annual Medicare reimbursement planning. Since 2026, the law has required two separate conversion factors, which the next section explains in detail.
Worked Example 1: One Service, Two Years
Formula: Payment = [(Work RVU × Work GPCI) + (PE RVU × PE GPCI) + (MP RVU × MP GPCI)] × Conversion Factor
Example: A service with 1.92 work, 1.52 practice expense, and 0.13 malpractice RVUs, with GPCIs of 1.02, 1.08, and 0.85, totals 3.7105 adjusted RVUs. In 2026: 3.7105 × $33.4009 = $123.93. Proposed 2027: 3.7105 × $32.8409 = $121.86, a $2.07 drop. RVUs and GPCIs here are illustrative.
How CMS Arrives at $32.8409?
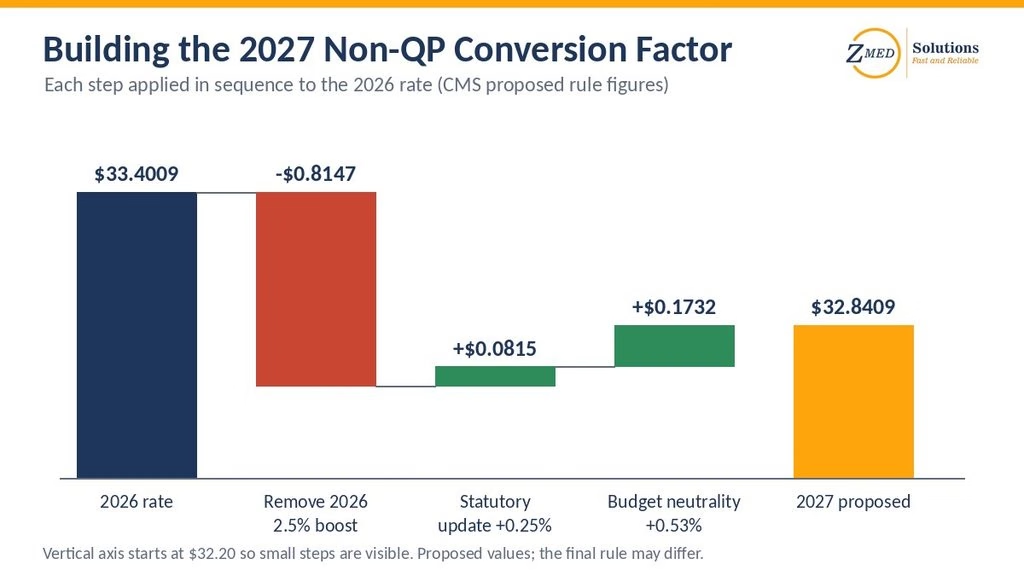
The 2027 Medicare conversion factor is built in layers. CMS starts with the 2026 rate, then removes the one-year 2.5% increase Congress provided for 2026. Next, it applies the statutory payment update of 0.25% for most clinicians. Finally, it applies a budget neutrality adjustment, which offsets RVU changes that would otherwise raise or lower total spending beyond a $20 million statutory threshold. This year that adjustment is positive, at 0.53%, tied to work RVU changes. The CMS fact sheet on the proposed rule confirms each component. Understanding the layers helps you judge which pieces Congress or CMS could still change.
Worked Example 2: Rebuilding the Proposed Rate
Formula: 2027 CF = 2026 CF ÷ 1.025 × (1 + statutory update) × (1 + budget neutrality adjustment)
Example: $33.4009 ÷ 1.025 = $32.5862. Then $32.5862 × 1.0025 = $32.6677. Finally, $32.6677 × 1.0053 = $32.8409, matching CMS’s proposed figure exactly. For qualifying participants: $33.5675 ÷ 1.025 × 1.0075 × 1.0053 = $33.1693.
Two Rates: Qualifying APM Participants Versus Everyone Else
Under MACRA, clinicians who reach participation thresholds in an Advanced Alternative Payment Model become a qualifying APM participant (QP). QPs receive a 0.75% annual update, while all other clinicians receive 0.25%. The gap is small in one year but compounds over time. The American College of Cardiology reports that CMS proposes making QP determinations at the TIN/NPI level rather than the NPI level for 2027. That change makes accurate enrollment and participation records essential. Reviewing them through your credentialing and contracting process now can prevent payments at the wrong rate in January.
Worked Example 3: What QP Status Is Worth
Formula: Annual value = Total adjusted RVUs × (QP conversion factor − Non-QP conversion factor)
Example: A clinician billing 5,000 adjusted Medicare RVUs a year: 5,000 × ($33.1693 − $32.8409) = 5,000 × $0.3284 = $1,642. That is roughly 1% more revenue, and the gap widens each year. The RVU volume is illustrative.
The Separate Anesthesia Conversion Factor
Anesthesia services use their own anesthesia conversion factor rather than the general rate. Payment combines base units for the procedure with time units, typically counted in 15-minute increments. CMS proposes $20.2143 for non-qualifying clinicians and $20.4165 for qualifying participants. According to Holland & Knight’s summary, these figures include a 0.30% specialty-specific practice expense and malpractice adjustment. Full methodology appears in the proposed rule in the Federal Register. Anesthesia groups should model this rate separately, since applying the general conversion factor would badly misstate their 2027 revenue.
Worked Example 4: An Anesthesia Case
Formula: Payment = (Base units + Time units) × Anesthesia conversion factor (before locality and modifier adjustments)
Example: A case with 5 base units and 60 minutes of anesthesia time (4 time units) totals 9 units. Non-QP: 9 × $20.2143 = $181.93. QP: 9 × $20.4165 = $183.75. Units are illustrative.
The 2027 Rate Against Recent History
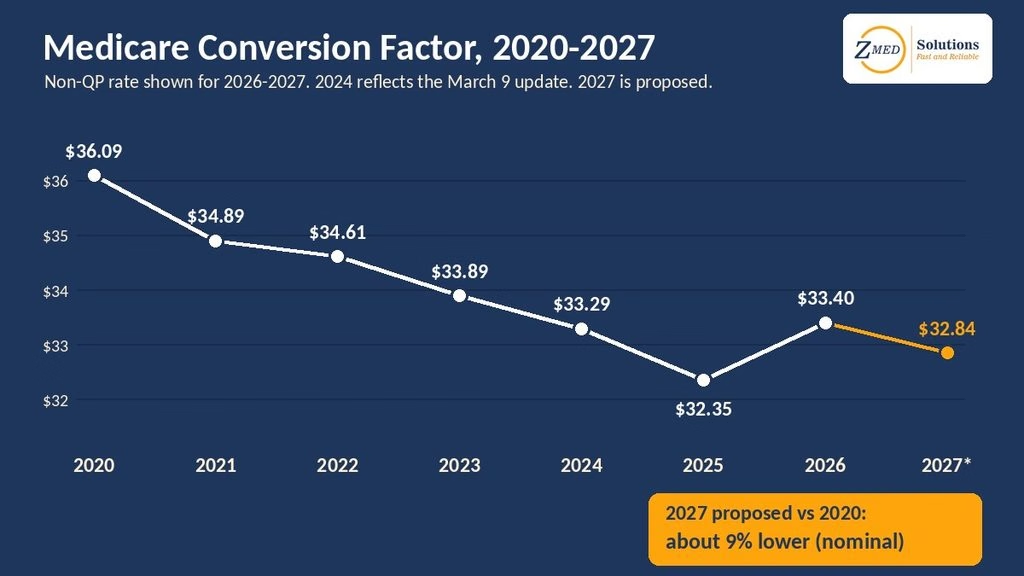
The conversion factor has drifted downward for most of the past decade. It stood at $36.0896 in 2020 and reached $32.3465 in 2025. The 2026 rise came mostly from a temporary congressional increase, not a lasting fix. The proposed 2027 non-QP rate sits about 9% below 2020 in nominal dollars. Once practice cost inflation is considered, the picture looks worse. An AMA analysis of Medicare updates versus inflation found physician pay fell 33% between 2001 and 2025 after adjusting for practice costs. That long-term squeeze explains why even a small 2027 cut draws strong attention from practice owners.
| Year | Conversion Factor | Context |
| 2020 | $36.0896 | Reference year |
| 2021 | $34.8931 | E/M revaluation offset |
| 2022 | $34.6062 | — |
| 2023 | $33.8872 | After Consolidated Appropriations Act, 2023 |
| 2024 | $33.2875 | From March 9 ($32.7442 earlier) |
| 2025 | $32.3465 | No temporary increase |
| 2026 | $33.4009 / $33.5675 | Non-QP / QP; includes one-year 2.5% |
| 2027 (proposed) | $32.8409 / $33.1693 | Non-QP / QP; proposed only |
Source: CMS published conversion factors for each year, as compiled by the AMA and specialty societies. 2027 values are proposed.
Why a Uniform Cut Lands Unevenly?
The conversion factor change applies equally to every service in each category. Your actual Medicare revenue change, however, also depends on code-level RVU revisions, the efficiency adjustment, and same-day visit policies. Those broader changes are covered in our 2027 Medicare physician fee schedule guide. A second, less obvious channel matters just as much. Many commercial payer contracts price services as a percentage of the current Medicare fee schedule. When Medicare’s rate falls, those contracts fall automatically unless the language fixes a specific year. That hidden pass-through often surprises practices when January remittances arrive.
How a Blended Average Hides Exposure?
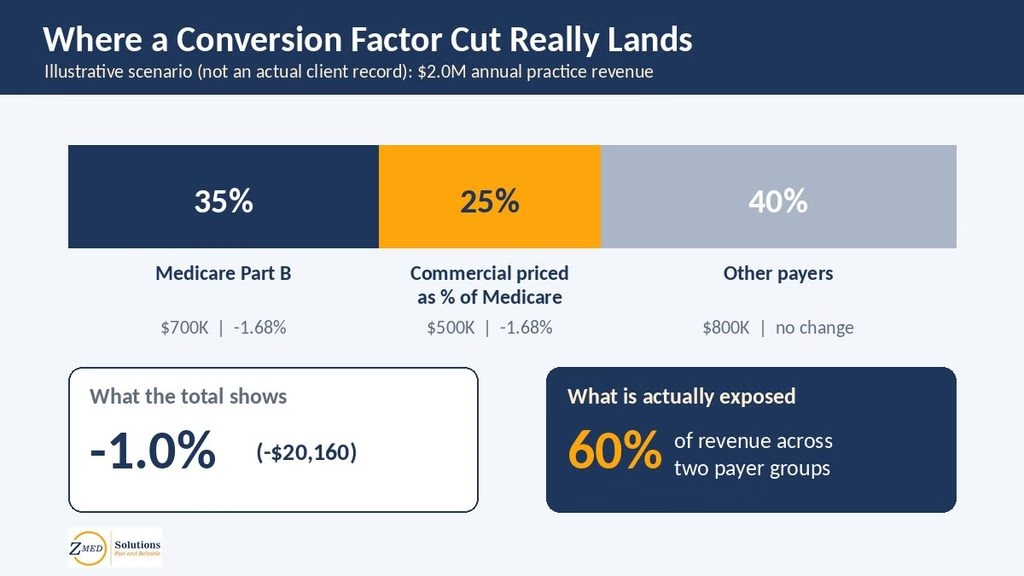
Illustrative scenario (not an actual client record): a practice earns $2.0 million a year. Medicare Part B contributes $700,000, commercial contracts priced off Medicare add $500,000, and other payers add $800,000. The exposed revenue is $1.2 million, and $1.2 million × 1.68% equals $20,160. Against total revenue, that is only a 1.0% decline. Yet 60% of revenue sits in two payer groups that both reprice on January 1. Looking at the blended figure alone would miss the commercial exposure entirely. Reviewing contract terms using proven payer contract negotiation tips can reduce that risk.
Putting the Proposed Rate in Context for Your Practice
Treat the conversion factor as a sensitivity test, not a forecast. Compare like with like: the same codes, locality, place of service, and QP status across full-year periods. A facility rate compared with a non-facility rate will mislead you every time. Also compare your results against practices of similar specialty, payer mix, and size rather than national headlines. If January payments come in below your model, treat that gap as a signal to investigate, not a verdict. The cause may be an outdated fee table or a posting error. Strong payment posting and reconciliation routines catch these gaps within weeks.
When Rate Adjustments Start Paying Off?
Some fixes show results within one remittance cycle, while contract changes take longer. The ranges below are general planning ranges, not guarantees for any specific practice.
| Adjustment | Partial Results | Full Results |
| Load final 2027 conversion factor and fee tables | 1–2 weeks | About 30 days |
| Update expected-payment tables and variance reports | 2–4 weeks | About 60 days |
| Verify QP status and enrollment records | 2–4 weeks | 60–90 days |
| Re-price commercial contracts pegged to Medicare | 30–60 days | 3–6 months |
| Renegotiate contract escalators or fixed-year pegs | 3–6 months | 6–12 months |
Conversion Factor Takeaways in Brief
- Proposed 2027 rates: $32.8409 (non-QP, −1.68%) and $33.1693 (QP, −1.19%); these are CMS proposals, not final.
- The cut comes from the expiring 2.5% one-year increase, partly offset by +0.25%/+0.75% updates and a +0.53% budget neutrality adjustment.
- Anesthesia rates are separate: $20.2143 (non-QP) and $20.4165 (QP), as proposed.
- The AMA’s analysis shows a 33% inflation-adjusted decline from 2001 to 2025.
- Loading the final 2027 Medicare conversion factor before January claims is an illustrative target, not a CMS rule.
Rate-Readiness Scorecard: 9 Questions for Your Team
Answer each question yes or no, then count your yes answers.
- Have you priced your top 20 Medicare codes at the proposed rate?
- Do you know each clinician’s QP status for 2027?
- Are anesthesia services modeled at the anesthesia conversion factor?
- Will the final rate load before your first January claims?
- Do you compare paid amounts with expected amounts every month?
- Have you listed commercial contracts priced as a percentage of Medicare?
- Do those contracts specify which year’s fee schedule applies?
- Does your 2027 budget use the proposed rate instead of 2026 rates?
- Does one person own tracking the final rule and Congress?
Scoring: 8–9 yes answers means you are well prepared, so focus on monitoring early 2027 payments. A score of 5–7 means partial readiness; fix gaps tied to your largest Medicare and pegged-contract revenue first. A score of 0–4 signals real risk, so start with questions 1, 4, and 6 this month.
Final Thoughts
The 2027 Medicare conversion factor looks like a modest cut, yet it touches every Medicare claim and often every Medicare-pegged commercial claim too. Practices that model it early, verify QP status, and review contract terms will absorb it with far fewer surprises.
Know which numbers are firm. The proposed rates, statutory updates, and budget neutrality adjustment are CMS-published proposals that may still change. Historical conversion factors are final published values, and the 33% decline is an AMA analysis. Example RVUs, scenarios, and targets like early fee table loading are illustrative.
Frequently Asked Questions
What is the 2027 Medicare conversion factor?
CMS proposed $32.8409 for most clinicians and $33.1693 for qualifying APM participants. Both are proposals until the final rule is published.
When will the final 2027 conversion factor be announced?
The AMA expects the final rule by about November 1, 2026. Congress can still change the rate later, as it did in March 2024.
Why is the conversion factor lower in 2027?
The one-year 2.5% increase for 2026 expires. Small statutory updates and a 0.53% budget neutrality adjustment only partly offset that loss.
Does the conversion factor change by location?
No, it is national. Geographic differences come from GPCIs applied to each RVU component before the conversion factor.
How does the anesthesia conversion factor differ?
Anesthesia uses its own proposed rates of $20.2143 (non-QP) and $20.4165 (QP), applied to base and time units.
What is a good way to estimate the impact on my practice?
Multiply your top codes’ adjusted RVUs by the rate difference, then add commercial contracts pegged to Medicare. That covers most of your exposure.
What is a good budget assumption for 2027 Medicare revenue?
A common practical approach is budgeting at the proposed rate and treating any congressional fix as upside. This is an illustrative planning choice, not guidance from CMS.
What is a good paid-versus-expected variance after January?
CMS publishes no benchmark. As an illustrative target, aim for near zero and investigate any code repeatedly paid below its expected amount.
Could Congress still change the 2027 conversion factor?
Yes. The Patients First Act (H.R. 9693) would add inflation-based updates, but it has not become law.
How does the conversion factor affect commercial payments?
Contracts priced as a percentage of the current Medicare fee schedule fall with it, unless they fix a specific fee schedule year.
When the In-House Team Needs Backup?
- No one has time to model the new rate against your code mix and payer contracts.
- Fee tables in your practice management system lag behind CMS updates.
- Paid amounts are not compared against expected amounts each month.
- Nobody knows which commercial contracts reprice automatically with Medicare.
- QP status or enrollment records have not been reviewed for 2027.
If several of these apply, consider outside support with a clear structure. A strong partner loads new rates promptly, reports variances by payer and code, and flags contracts pegged to Medicare. It should also keep enrollment current, audit coding, work denials to their root cause, and provide transparent monthly reporting. Ask a prospective partner how it handled the March 2024 mid-year rate change. That answer quickly shows whether its team plans ahead or reacts after revenue has already slipped.
Zmed Solutions is one example of this end-to-end structure. Its team combines billing, credentialing, coding, denial management, and compliance support in one coordinated revenue cycle management workflow. For the 2027 Medicare conversion factor, that means updating rate tables, reviewing QP-related enrollment, and monitoring early remittances for unexpected variances. Results vary by practice, specialty, and payer mix, so no specific outcome can be promised.
Sources and Methodology Notes
- (a) Published standards and definitions: 2027 conversion factors, statutory updates, the expiring 2.5% increase, and the budget neutrality adjustment come from the CMS CY 2027 proposed rule and fact sheet. Historical rates are CMS-published final values. The payment formula follows CMS methodology.
- (b) Named data sources: anesthesia conversion factors as summarized by Holland & Knight; QP determination changes as reported by the American College of Cardiology; the 33% inflation-adjusted decline from the AMA’s analysis.
- (c) Practical and illustrative targets: example RVUs, GPCIs, units, payer scenarios, timeframe ranges, and fee table timing reflect general revenue cycle practice.
- (d) Survey data: none used.
Actual results vary by practice and situation. All figures reflect information available on September 25, 2026, and the final rule may change them.
Ready to optimize your medical billing and boost your revenue? Look no further. Zmed Solutions LLC is your trusted partner in professional Medical Billing Services.
Join our growing network of healthcare providers who have already elevated their revenue with our expert services. Don't miss out on what could be your practice's most profitable decision.
Schedule a Consultation Today!
Contact Us Now, and experience the difference. Your financial success starts here!